El Niño Status 2018-2019
The El Niño Southern Oscillation (ENSO) phenomenon started from mid-2018 and ended in June 2019, the intensity was from a weak to moderate El Niño condition. The Tropical Pacific temperature anomaly in the ENSO 3.4 region reached a maximum value of 1.3 ° C. In July it is declared again as a neutral phase. During the second semester of 2019 the anomaly varied from 0.3 to 0.7 ° C, which is why the international institutions dedicated to the study of climate declared a return to Neutral condition or climatic normality.
However, in recent months the anomaly of the Sea Surface Temperature in the Tropical Pacific for region 3.4 has remained positive, but within the range of Neutrality, climatic sequelae characteristic of the El Niño condition continue to occur (figure one). From October 2019 to the first days of the year 2020, anomaly values around 0.5 ° C have been presented in the ENSO 3.4 region, indicating that atmospheric and oceanic circulation patterns are maintained throughout much of the Pacific.

Fig. 1. Anomaly of the surface temperature of the Tropical Pacific Sea (NOAA, 2020). Red Table 3.4 ENSO region

Fig. 2. Anomaly of the average sea surface temperature in ENSO region 3.4 (NOAA, 2020)
The International Research Institute for Climate and Society (IRI) extensively forecasts the ENSO phenomenon. The IRI, which uses the outputs of the climate models of various institutions dedicated to climate issues, currently forecasts that the Neutral phase will possibly continue until summer, but with the probability of close to 40% of the return of a new El Niño event in the year 2020 (figure 3).

Fig. 3 Probability forecast of ENSO evolution in 2017
Observed Precipitation in the Americas
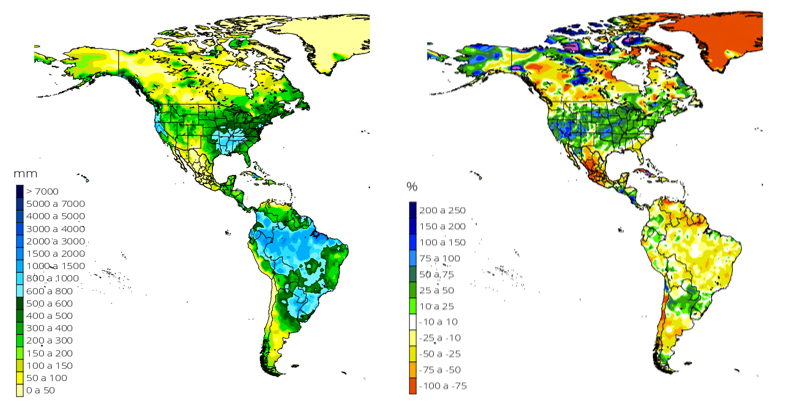
Figures 4 and 5 show the rainfall records in mm and the percentage anomaly of the rainy seasons for both hemispheres: January to May for South America and May to October for North America.
North America: During the first semester of the year, there were above normal rains mainly in the US due to frontal systems that determined a surplus of precipitation. For their part, Canada and Mexico had below average rainfall. In Mexico, during the months of May to October, rainfall was below the historical average almost in a generalized manner, which caused a great drought, especially in states of the Gulf of Mexico that extended to Central America. This had a strong impact on agricultural insurance.
Central America: In the period from January to October 2019, above-average rains occurred except for Honduras and the northern region of Nicaragua, which had rainfall deficits that could seriously affect agricultural production during this period in these countries. However, the rain was irregular causing sections with drought in Guatemala, Honduras and El Salvador.
South America: In 2019 accumulated rains from 1000 to 1500 mm were recorded in Colombia, Peru, Ecuador, Bolivia, Venezuela and western Brazil. Despite these levels of precipitation, there is a marked drought condition almost in general in South America, being this critically in Chile and western Argentina. The agriculture of the Southern Cone was affected by this drought in addition to a higher incidence of hail.

Fig. 4. Accumulated Precipitation (mm) and anomaly (%) from January – May 2019

Fig. 5. Accumulated Precipitation (mm) and anomaly (%) from May – October 2019
Drought Indicators
According to drought indices, 2019 was a year with rain deficiency in various regions of America. Figure 5 shows the North American Drought Monitor (NADM) in the month of September 2019 highlighting the great territorial extension of drought in Mexico, the southern United States and in areas of Canada. Figure 6 shows the Standardized Precipitation and Evapotranspiration Index (SPEI), in 6-month periods for June (January – June) and December (July-December) of 2019. The SPEI identifies that Mexico, Central America and South America have been affected by moderate to extreme drought conditions in June. By December, the drought affects the southeastern United States, eastern Mexico, and central and southern South America, so it is anticipated that this would affect crops in Central America due to rainfall deficits, in the same way in Brazil and Chile.

Fig. 6 North American Drought Monitor, 2020

Fig. 7. Standardized Precipitation and Evapotranspiration Index SPEI (https://spei.csic.es) 6 months from June (left) and December (right)
Climate Expectation: January – June, 2020.
From the condition of the ENSO in a neutral phase with a tendency towards El Niño, at least until February 2020, and according to the outputs of the forecast models, it is expected:
North America, a warm condition over western Canada, in the US above normal rain conditions are expected, mainly in the south and southeast region. For Mexico, below normal rains are expected during the first quarter and close to the average during April to June.
Central America with a probability of rainfall below the historical average, highlighting in Honduras and Nicaragua where the drought that affects for human consumption and food production since September 2019.
South America, the forecast models foresee a strong deficit of rains from January to March over the northeastern region of South America, being the most affected countries Venezuela, Guyanas and Suriname; for the months of April to June with the possibility that the rains are below the historical average in sections of Chile and Argentina. The regions not mentioned are expected near the historical average conditions.


Comments are closed.